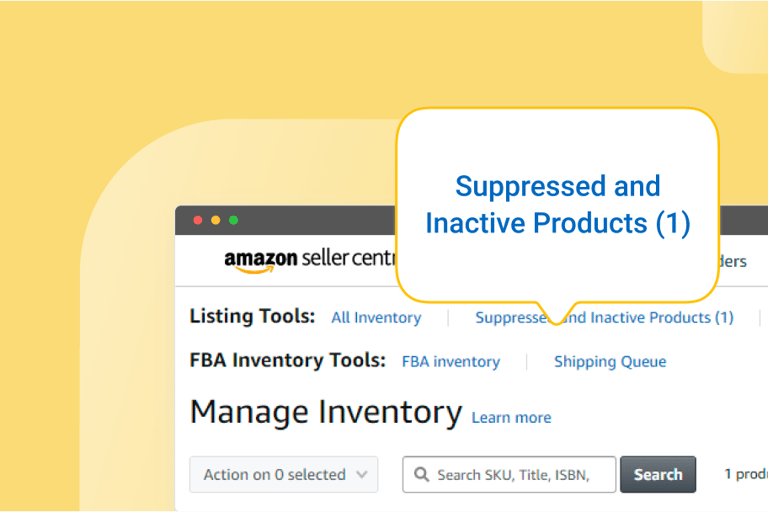
Is your brand experiencing any issues with suppressed or inactive listings?
One of our clients faced this exact issue—their best-selling product was suppressed for over three weeks before Brand Astronauts took over the account, resulting in more than $175,000 in lost sales due to the listing being inactive.
Once Brand Astronauts stepped in, we leveraged our internal connections at Amazon and escalated support cases to identify and resolve the root cause, which triggered a system refresh that brought the listing back live within a week.


Fixing Broken Ad Performance Across Marketplaces
One client came to us frustrated with rising ad costs and poor returns across both Amazon and Target. Their blended ROAS was below 2.0, and they had no clear path to scale without burning through their budget.
🔍 What We Found During the Audit:
Across both platforms, several inefficiencies were holding them back:
Campaign structures were disorganized—branded and non-branded sales weren’t clearly separated, making it hard to track what was actually working.
They were heavily overspending on automatic campaigns due to a lack of proper negative keyword management.
Budgets were poorly distributed between campaigns, with no strategic allocation.
High-spend, low-performing SKUs were eating up budget, while better-performing SKUs were left underfunded.
Keyword research and competitive analysis were minimal to nonexistent.
Campaign segmentation was missing altogether, and many key SKUs weren’t even being promoted.
✅ What We Did:
Completely rebuilt their campaign structures with clear segmentation and high-intent keyword targeting.
Implemented dayparting and geo-targeting on Target to reach peak-converting shoppers better.
Integrated retail media analytics to uncover true incremental performance and eliminate wasted spend.
Set up live performance dashboards for both platforms, enabling smarter and faster decisions.
📈 The Results (Within 60 Days):
Blended ROAS improved from 1.8 → 4.7
Cost-per-acquisition dropped by 36%
Total ad revenue increased by 72%
CTR rose by 44%
CPC reduced by 18%
Bleeding Margin? Here’s How We Turned It Around.
One of our clients—a mid-sized household goods brand—was seeing solid sales but struggling to stay profitable on Amazon. Margins were thin, Buy Box ownership was inconsistent, and increasing fulfillment fees were eating into every order.
🔍 What We Found During the in-Dept Audit
Buy Box win rate was just 48% across key SKUs due to outdated static pricing and reseller competition.
SKUs were priced too low relative to costs, with over 40% of the catalog below the 20% profit margin threshold.
They had no tool in place to dynamically adjust pricing based on real-time market conditions or competitor behavior.
✅ What We Did:
Implemented an advanced AI-powered repricing tool that optimized pricing based on Buy Box eligibility, profit floor protection, and competition.
Audited cost structure and raised pricing on low-margin SKUs without impacting sales velocity.
Set up profit-focused rules and dashboards to monitor pricing, Buy Box %, and fee changes in real time.
📈 The Results (Within 30 Days):
Buy Box win rate increased from 48% → 94%
Average profit per unit grew by 34%
Monthly net profit increased by 62%, reaching a profit margin of over 32% after all fees.
Over $7,400 saved in fees in just 6 weeks
Now, instead of guessing pricing and eating fees, the brand has full control of profitability while holding the Buy Box on nearly all top-selling items.


Too Many Campaigns, Too Little Return? Here's What Clean Structure Can Do
A growing food & beverage brand came to us after struggling to gain traction on Instacart. Despite decent search volume for their category, they were barely getting sales. ROAS was sitting around 1.4, and they weren’t sure if Instacart was even worth the spend.
🔍 What We Found During the Audit:
The Sponsored Products campaigns currently consist only of automatic targeting, resulting in significant wasted spend.
Some products are underperforming compared to others and should be paused so that the budget can be reallocated to better-performing items, ultimately improving overall campaign efficiency.
The campaigns contained too many keywords within a single ad group, leading to inefficient budget allocation. As a result, high-performing keywords didn’t receive adequate spend while low-performing ones drained the budget.
There were too many ad groups within a single campaign, which diluted the budget and prevented each ad group from receiving enough spend to optimize performance.
✅ What We Did:
Paused underperforming products and shifted spend toward higher-margin, better-converting items.
Broke down bloated ad groups and segmented campaigns by match type and intent—ensuring budget flowed to the best-performing keywords.
Isolated top-converting terms into dedicated exact match campaigns and applied negative keywords to cut wasted spend.
Restructured campaigns to limit the number of ad groups per campaign, allowing each to receive enough budget to optimize properly.
Set up performance dashboards to track keyword-level efficiency and make real-time bidding decisions.
📈 The Results (Within 30 Days):
ROAS increased from 1.6 → 2.95
Wasted spend dropped was removed through keyword and product-level optimization
Conversion rate improved by 34%, driven by better keyword targeting
Sales from high-performing products grew by 71% as the budget was reallocated strategically
The number of campaigns needed to drive growth was reduced by 40%, simplifying account management
By implementing a clean structure, smarter targeting, and prioritizing performance-first budgeting, we turned a cluttered, inefficient ad account into a lean, high-return growth engine.